Track price, production, demand, risk, infrastructure, and country exposure together.
Energy Analytica
Energy market analysis software for decision teams.
A command-center workspace for monitoring oil, gas, power, infrastructure, country exposure, company profiles, market signals, and analyst follow-up.
Built for analyst workflows
Starts with one reporting process
No system access needed first
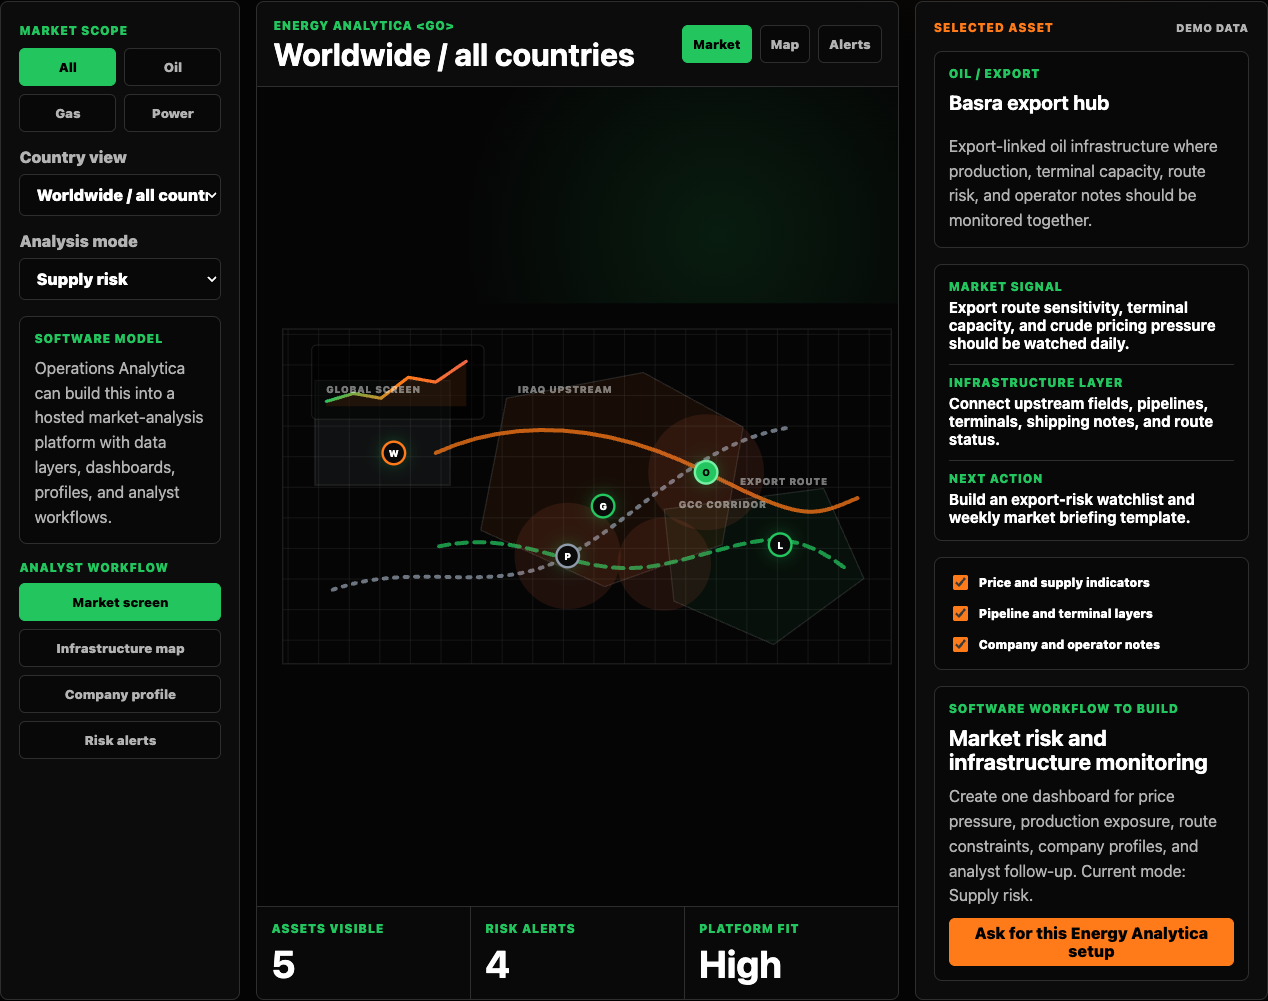
Live software panel
Use it like an energy market analysis workspace.
Filter by commodity, change country scope, switch analysis mode, and select infrastructure records. The right panel updates like a real analyst command center.
Map fields, pipelines, terminals, refineries, power assets, and operational constraints.
Connect assets, operators, partners, contracts, profile notes, and follow-up actions.
What the software does
It brings market signals, infrastructure, and analyst workflow into one platform.
Market command center
Track pricing pressure, supply risk, demand signals, production exposure, and country-level watchlists.
Infrastructure map
Organize fields, pipelines, terminals, refineries, power nodes, routes, and operational constraints.
Company intelligence
Attach operator profiles, partner notes, service-company records, contracts, and follow-up tasks.
Analyst workflow
Turn research into alerts, briefings, watchlists, opportunity lists, and decision-ready reports.
What a serious demo should clarify
The walkthrough is about decision workflow, not dashboard decoration.
A useful energy intelligence demo should explain how market signals become watchlists, briefings, alerts, and decision-ready context for the team.
Signal model
Clarify which prices, assets, countries, companies, risks, and infrastructure layers the team actually tracks.
Analyst workflow
Review how research moves from source monitoring to notes, alerts, briefings, and management-ready output.
Data boundaries
Start with public, sample, or redacted context. Confidential datasets and credentials are not needed for the first walkthrough.
Implementation path
Decide whether the right next step is a prototype, a workflow audit, a reporting sprint, or no platform build yet.
Software demo path
Request an Energy Analytica walkthrough.
Use the software demo request when you want to discuss the market analysis workspace, data layers, reporting rhythm, and walkthrough timing.